
Discrete Fourier Transform
The Fourier Transform is a powerful mathematical technique that allows us to analyze the different frequency components within a signal or shape. Its discrete version, the Discrete Fourier Transform (DFT), is used when working with numerical data. I studied the Fourier Series here before. One of the most fascinating aspects of the DFT is that it can represent a signal or shape using rotating circles (or vectors). Each circle corresponds to a specific frequency, amplitude, and phase. When connected in sequence, these circles collectively recreate the original shape over time. With this approach, we can reconstruct even a complex curve using simple harmonic motion. As usual, I chose my website’s logo as the testing curve. Below is the result:
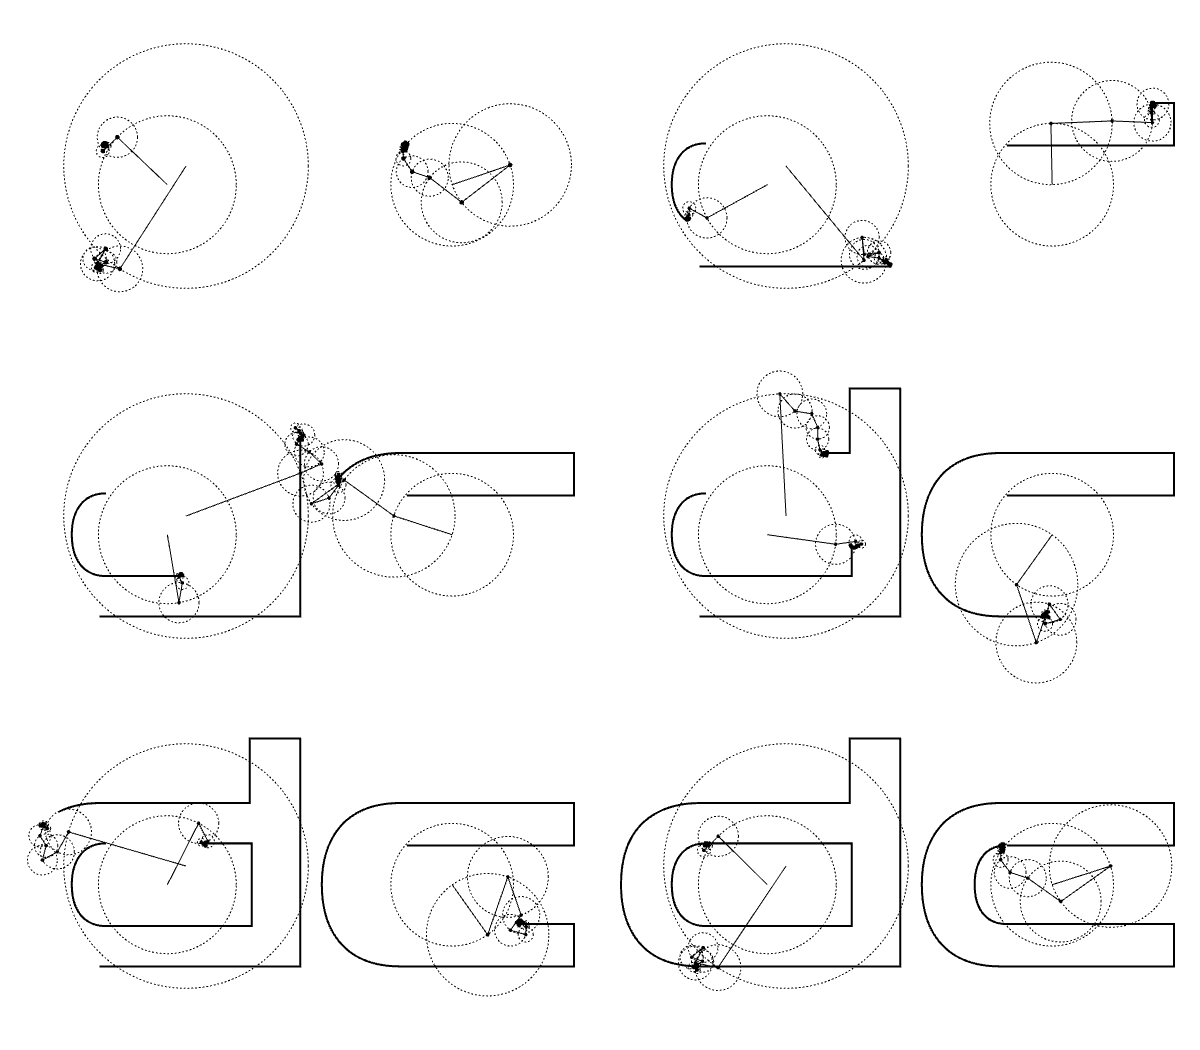
For example, consider a closed curve. If we sample this curve into a list of points and represent each as a complex number (like x + iy), we can apply the DFT to extract the frequency components. 3Blue1Brown, Mathologer, and the Coding Train have beautiful videos on the math behind the DFT. I watch them with pure interest and excitement. The result of the DFT algorithm is a series of rotating vectors, each spinning at a specific rate. The tips of these vectors trace out the original shape as time progresses. The resulting animations are usually beautiful and deeply intuitive. Below is the Grasshopper definition and the Python code that calculates the rotating circles. It is a Python 3 component, so it may only run in Rhino 8. Below is the content of the Grasshopper Python component:
import cmath, math, Rhino
count = 200
points = [curve.PointAtNormalizedLength(i / float(count)) for i in range(count)]
samples = [complex(p.X, p.Y) for p in points]
def dft(signal, num_terms):
	N = len(signal)
	result = []
	for k in range(-num_terms // 2, num_terms // 2):
		c = complex(0, 0)
		for n in range(N):
			angle = -2 * math.pi * k * n / N
			c += signal[n] * cmath.exp(complex(0, angle))
		c /= N
		result.append((k, c))
	return result
fourier = dft(samples, N)
def epicycles(fourier, t):
	x, y = 0.0, 0.0
	vectors = []
	for freq, coef in sorted(fourier, key=lambda x: abs(x[1]), reverse=True):
		radius = abs(coef)
		phase = cmath.phase(coef)
		angle = 2 * math.pi * freq * t + phase
		dx = radius * math.cos(angle)
		dy = radius * math.sin(angle)
		start = complex(x, y)
		end = start + complex(dx, dy)
		vectors.append((start, end, radius))
		x, y = end.real, end.imag
	return vectors, complex(x, y)
vectors, tip = epicycles(fourier, t)
circles = []
lines = []
for start, end, radius in vectors:
	center = Rhino.Geometry.Point3d(start.real, start.imag, 0)
	endpoint = Rhino.Geometry.Point3d(end.real, end.imag, 0)
	circle = Rhino.Geometry.Circle(center, radius)
	line = Rhino.Geometry.Line(center, endpoint)
	circles.append(circle)
	lines.append(line)
tip_point = Rhino.Geometry.Point3d(tip.real, tip.imag, 0)
Cite this post
Related Posts
Generating Harmonic Motion
September 21, 2026
While trying to program the curves produced by Spirograph toys in Grasshopper, I took a slightly different path. The topic eventually led to a broader heading: harmonic motion, and from there, to the Fourier Series we looked at previously. This simple Python code models Fourier Synthesis, driven by circles of different radii in a very straightforward way. The Python component sets up a loop that calculates the effect of each circle to the x and y values, individually. In this…
Fourier Series
November 14, 2022
This is my first experiment with the Fourier Series in Grasshopper using Python. This is a technique to decompose functions into their frequency components. Fourier series have a wide range of applications in physics and engineering. What makes it especially fascinating, however, is the visual intuition it offers. It looks like a kind of mathematical “magic” that emerges from the geometry of frequency. I explored several excellent visual explanations online, including those by Coding Train, 3Blue1Brown, and Mathologer, each offering…
B-Spline Construction
January 25, 2024
I have been studying the Bezier-De Casteljau algorithm for several years. Last week, I finally managed to understand and implement B-Spline Construction in Rhino and Grasshopper Python code, using the Cox-De Boor algorithm. This algorithm calculates the effect of control points on a B-Spline with many control points. After this, I am not limited to the degree+1 control points. This animation shows both algorithms working together. This Rhino Python code in a Grasshopper definition can handle three tasks. The first…
Attractor Basics
June 29, 2023
In this short tutorial, I want to give Grasshopper beginners the basics of how we create attractor systems. The Grasshopper definition you see in the below figure is the equivalent of array-type copying operations in CAD. However, unlike in CAD programs, here we are dealing with multiple generations of objects rather than transformations. Attractor Basics: Data Matching In the application you see in the figure below, each row of the hexagonal grid created with HexGrid has a different radius value….
Conformal Circle Packing
September 19, 2012
After a couple of days of studying the mysterious Doyle spiral, I’ve decided to test an approach of circle packing from conformal mapping. First, I tried to understand the Poincare disk (earlier at here, here, and here and here). I used it as the hyperbolic representation of space on a two-dimensional plane. Then, I linked a regular hexagonal grid and rebuilt it after the hyperbolic distortion. This led me to find the below hexagonal grid. Therefore, it looks like a suitable…