
Derivative and Slope
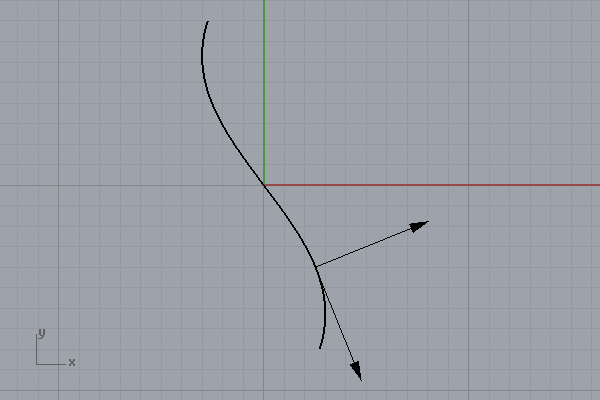
Yes, interesting topics started to reveal themselves, when I dig into the function curves, especially in the parametric representation. The first interesting application is the “derivative”. Nobody in high school told me that the derivative of a function at a given point gives the slope of the graph at that point. Moreover, it is possible to convert the slope value into an angle in degrees, showing the angle of the tangent line to the x-axis at that point. They are very interesting and intuitive for me to understand the deep relationship between maths and all computational tools designers use today. Below is the simplest possible Python script that calculates the slope and tangent angle at a given point of a parametric function graph. It also visualizes the outputs (if you don’t believe me). There are a lot more topics in this and other fields of math, that are waiting to be studied.
Of course, I only approximate the derivative calculation by using a very very small number for “dt”, escaping from the limits. The formula for calculating the derivative is very interesting. I love the elegance of f(x + dx) there… I couldn’t keep myself from drawing that;
# Slope of Parametric Functions
import rhinoscriptsyntax as rs
import math
def f(t): return 3 * math.sin(t)
def g(t): return - 4 * t
def derivativeF(t,dt): return (f(t + dt) - f(t) ) / dt
def derivativeG(t,dt): return (g(t + dt) - g(t) ) / dt
def evaluate(t):
	# Evaluate f(t),g(t) and place a point on f(t),g(t)
	point = (f(t),g(t),0)
	print "Parametric function is evaluated at t =",t
	print "Resulting point is at",point
	rs.AddPoint(point)
def graph(t0,t1,dt):
	# Draw a graph of f(t),g(t) by given domain and step size
	points = []
	t = t0
	while t <= t1:
		points.append((f(t),g(t),0))
		#evaluate(t)
		t = t + dt
	points.append((f(t1),g(t1),0))
	rs.AddPolyline(points)
	print "Domain of t is",t0,"to",t1
	print "Number of samples used:",len(points)
def slope(t,dt):
	# Slope is the instantaneous ratio of vertical change to horizontal change (dy / dx) at a point
	# In a parametric function, slope is dy / dx = (dy / dt) / (dx / dt)
	dF = derivativeF(t,dt)
	dG = derivativeG(t,dt)
	d = dG / dF
	print "Slope is",round(d,3),"at t =",t
	# Slope of f(t),g(t) indicates the direction of its graph
	if d > 0: print "Graph increases from left to right at t =",t
	if d < 0: print "Graph decreases from left to right at t =",t
	if d == 0: print "This is a constant function"
def tangent(t,dt):
	# Tangent is the direction given by the slope
	start = (f(t),g(t),0)
	dF = derivativeF(t,dt)
	dG = derivativeG(t,dt)
	d = dG / dF
	angle = math.degrees(math.atan(d))
	end = rs.Polar(start, angle, 6)
	curve = rs.AddLine(start,end)
	rs.CurveArrows(curve,2)
	# Slope is the tangent result of the angle between the tangent line and x axis
	print "Tangent angle is",round(angle,3),"to the x-axis at t =",t
def normal(t,dt):
	# Normal is the direction perpendicular to tangent
	start = (f(t),g(t),0)
	dF = derivativeF(t,dt)
	dG = derivativeG(t,dt)
	d = dG / dF
	angle = math.degrees(math.atan(d))
	end = rs.Polar(start, angle + 90, 6)
	curve = rs.AddLine(start,end)
	rs.CurveArrows(curve,2)
	print "Normal angle is",round(angle + 90,3),"to the x-axis at t =",t
graph(-2,2,0.01)
slope(1,1/10000)
tangent(1,1/10000)
normal(1,1/10000)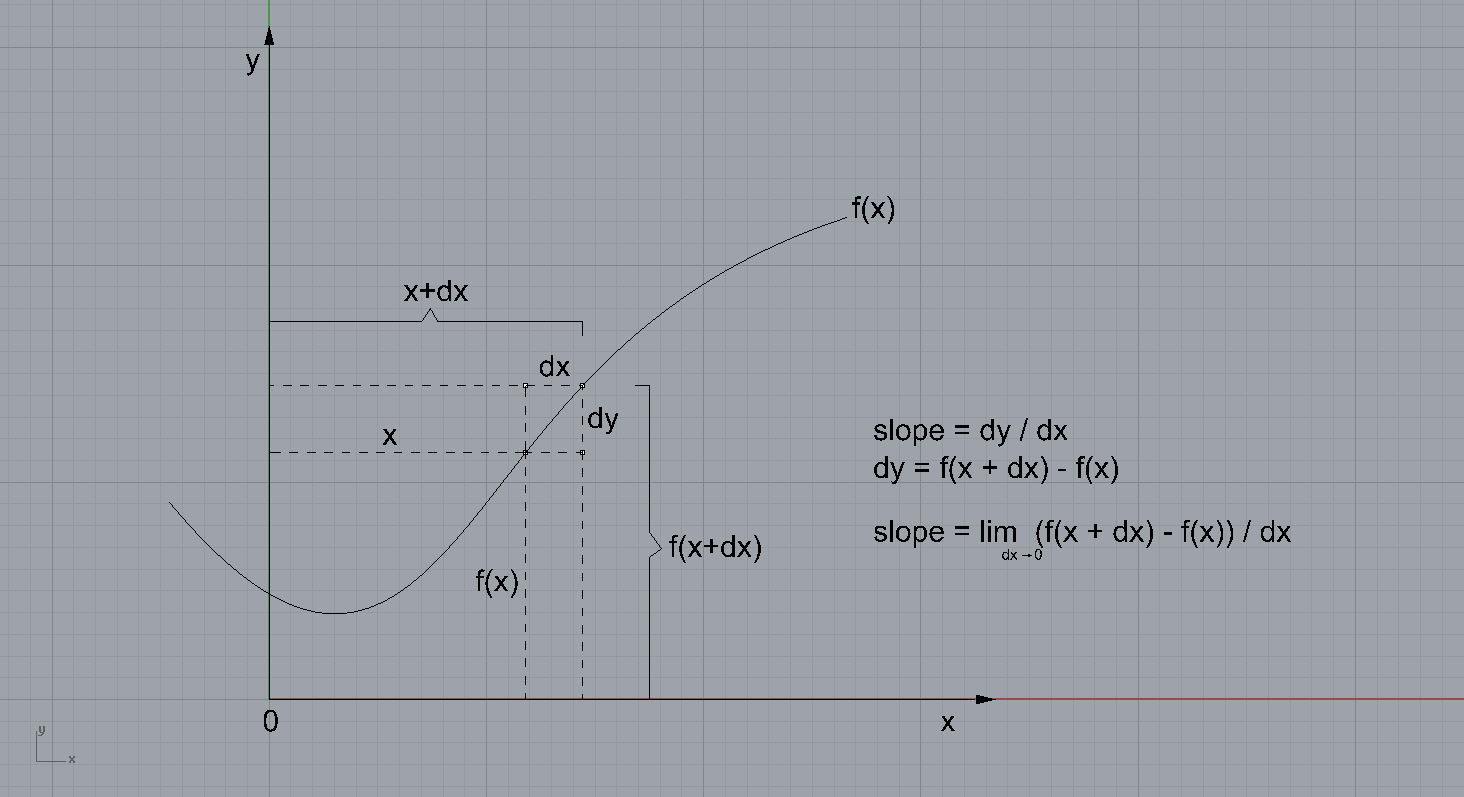
The above drawing is for an explicit function graph (y = f(x) style). In a parametric curve, the overall derivative is calculated by dividing the derivatives of g(t) and f(t). You’ll notice that in the Python code.
Cite this post
Related Posts
Calculating a Guitar’s Surface Area with Bézier Curves
August 27, 2024
Below is the first paper of my son, Mete Yazar. It is about a mathematical and geometric exercise of calculating the surface area of an arbitrary shape (a classical guitar’s body panel). He did a good job in utilizing Bezier/de Casteljau curves and generating the parametric equations of the piecewise curve. I helped him to validate the results by using rhinoceros CAD software. Therefore, it seems that his calculations are correct. In this paper, we attempted to calculate a guitar’s…
Discrete Fourier Transform
May 8, 2025
The Fourier Transform is a powerful mathematical technique that allows us to analyze the different frequency components within a signal or shape. Its discrete version, the Discrete Fourier Transform (DFT), is used when working with numerical data. I studied the Fourier Series here before. One of the most fascinating aspects of the DFT is that it can represent a signal or shape using rotating circles (or vectors). Each circle corresponds to a specific frequency, amplitude, and phase. When connected in…
Quick Parametric Curves
July 28, 2024
Here is the shortest possible way of generating quick parametric curves in Rhino Python. So, you may change the f, g, and h functions to test any function curve. In this Python code, the list comprehension [(f(t), g(t), h(t)) for t in [t0 + i*dt for i in range(int((t1-t0)/dt)+1)]] works by first generating a list of t values from t0 to t1 with an increment of dt using the inner comprehension. The outer comprehension then iterates over these t values,…
B-Spline Construction
January 25, 2024
I have been studying the Bezier-De Casteljau algorithm for several years. Last week, I finally managed to understand and implement B-Spline Construction in Rhino and Grasshopper Python code, using the Cox-De Boor algorithm. This algorithm calculates the effect of control points on a B-Spline with many control points. After this, I am not limited to the degree+1 control points. This animation shows both algorithms working together. This Rhino Python code in a Grasshopper definition can handle three tasks. The first…
Curve Equations Revisited
October 14, 2021
This is the continuation of the previous post on parametric curve equations. In this new version, the script picks a NURBS curve from the user. Then, it analyses the curve’s degree and control points. Unfortunately, only the curves with degree+1 number of control points can be processed. In the future, I hope that I will be able to extend this script to include multi-span curves with more than degree +1 control points. Finally, the script creates the three functions for…