
Slope Map on Terrains
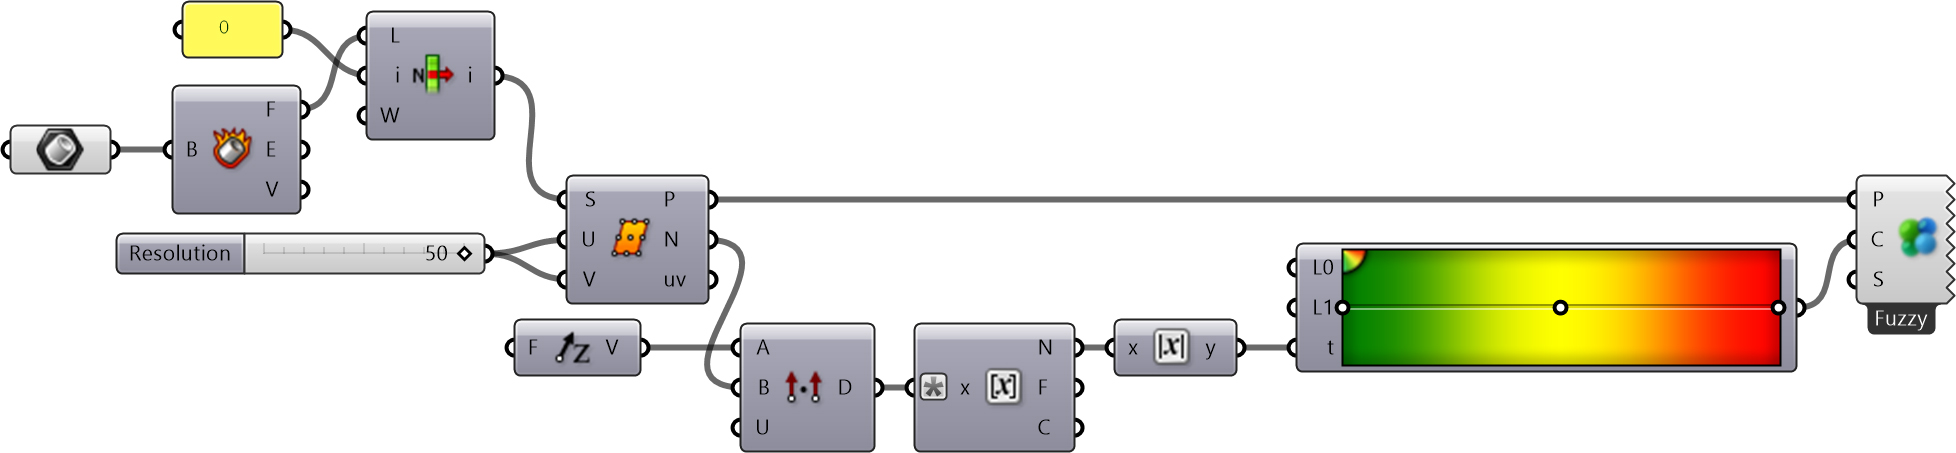
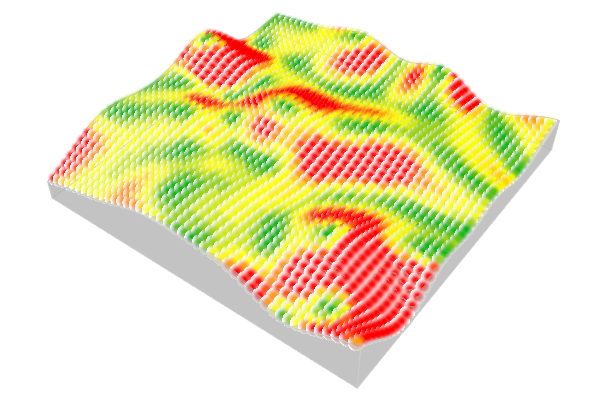
I previously shared the Grasshopper definition for terrain generation that we used in last year’s studio midterm. One of the goals of this project was to take the first step toward developing students’ skills in understanding, processing, and utilizing terrain data as a design input. To support this objective, we provided them with small supplementary tools. One of these tools was the slope map. As you can see, this is quite a simple Grasshopper definition. It computes the slope of a given surface. To do this, we calculate the dot product of the surface normal vectors at evaluated points and the World-Z vector. For the given dimensions, this value ranges roughly between 90 and 100 and is visualized using colored dots. You may need to recalibrate these values when analyzing your own surfaces. On this occasion, it is worth recalling what the dot product actually is. According to Khan Academy:
The dot product is a fundamental way we can combine two vectors. Intuitively, it tells us something about how much two vectors point in the same direction.
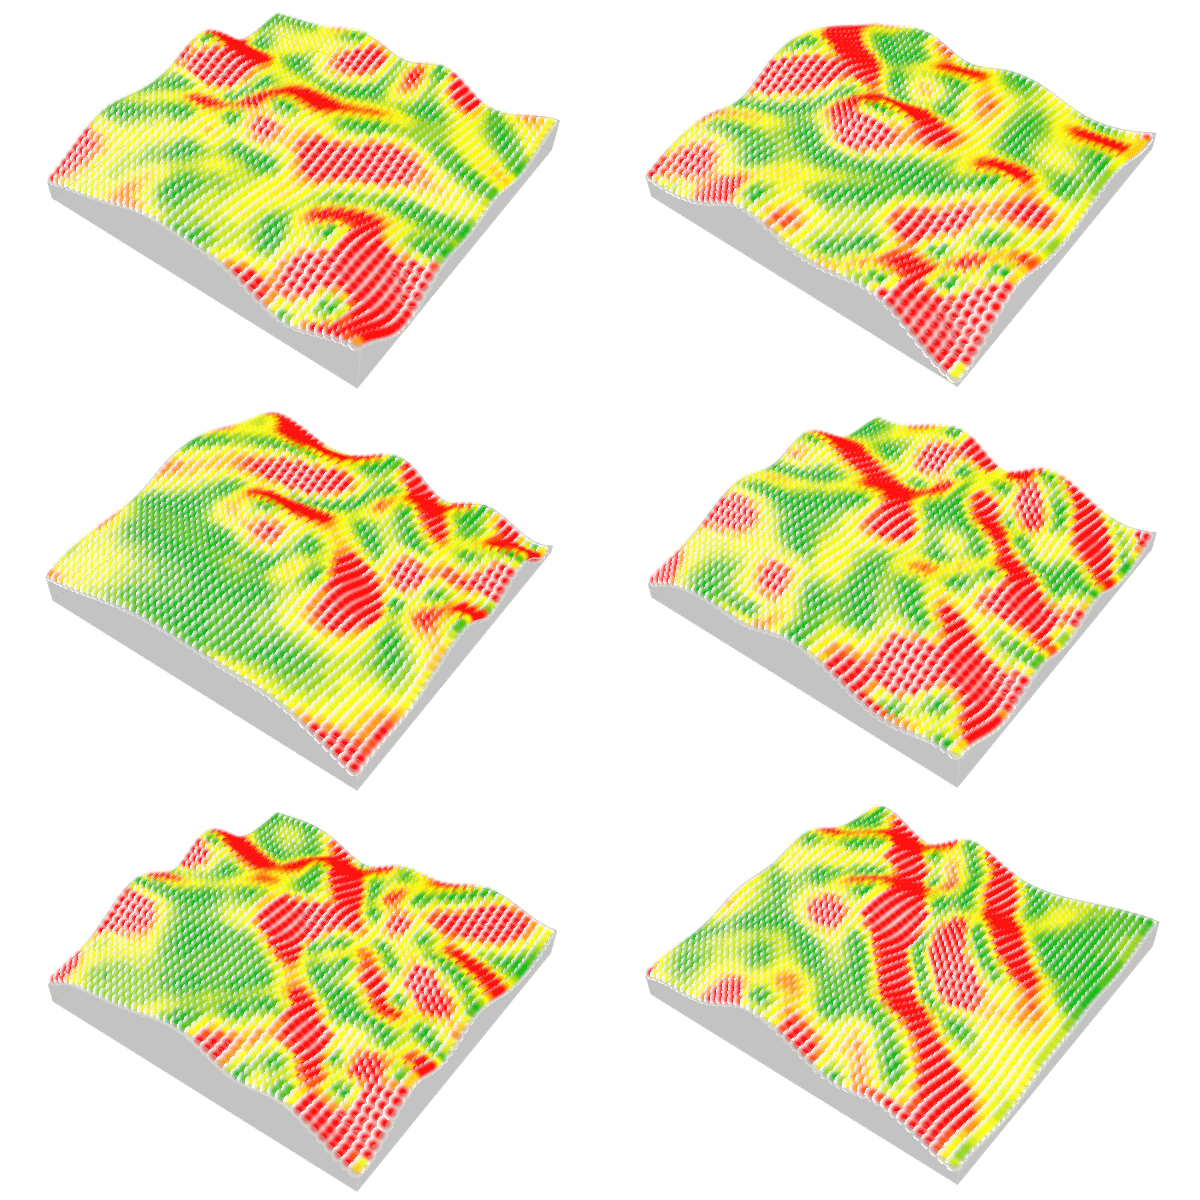
If you recall, this was also a calculation I explored using Python in my Design Mathematics course. You can find the dot product explanation and Rhino Python implementation here. Particularly when learning mathematics and geometry, we often wonder how this knowledge will be useful to us. Truth be told, not every piece of knowledge has to serve an immediate practical purpose. Yet, as you can see, some of it genuinely does. You can download the Grasshopper definition below. For the animation, I stepped the SEED values in the Terrain Generator code between 6.0 and 6.2.
Cite this post
Related Posts
Terrain Generator
August 13, 2026
Last year, for the midterm assignment in our first-year basic design studio, we gave our students a range of different, randomly generated contexts to work with. For this purpose, I developed a small Grasshopper tool that makes the graph of a function look as much like a terrain model as possible. This tool is not really a procedural terrain generator. I would genuinely like to build one, someday. What we have here is simply a function surface. At the inputs,…
Vector Projection and Angle
December 21, 2021
In this session, I will add two new methods to the Vector class. I think this will finish the basics for the vectors. In the future, we are going to need several new methods like adding multiple vectors and interpolation. But for now, I think this would be sufficient to further advance into parametric curves and surfaces. These new methods will be based on the dot product method we created in the last post. I will add the vector projection…
Vector Normalization and Dot Product
October 29, 2021
This is the continuation of the Vector class we started here, and further advanced here, here, and here. This new Rhino Python implementation is mostly educational and partially a hobby. Before this session, we have developed display, magnitude, add, multiply, reverse, and subtract methods. This time, I am adding the vector normalization and dot product methods and seeing the utilizations of the dot product. Line Explanation 1-26 Already explained in the previous posts. 27 Define a new method called “normalize”….
Vector Magnitude Method in Rhino Python
October 12, 2021Today, I am going to make only one addition to the Vector class we recently started in Rhino Python. The magnitude of a vector can be easily calculated by assuming that the axes (2 or 3 axes) of it are perpendicular to each other. This gives us an opportunity to assume a right triangle visually, and calculate the magnitude (length) of a vector by using the Pythagorean Theorem. In short, if you square and add the components of a vector,…
More Vector Operations in Rhino Python
September 1, 2021This is the continuation of my new project of re-creating the parametric curve and surface methods of Rhino via Python scripting. If you remember, I started with the building block of vector operations, here and here. Then, I defined vector addition and multiplication, before going deeper into the geometric calculations. In fact, they are using the previously defined addition and multiplication methods. New Vector Operations: Subtraction and Reversing In the future, we are going to need to reverse a vector,…