
Graph of Parametric Functions
This RhinoPython script handles the simple graphs of two-dimensional parametric functions. Therefore, it approximates these functions by drawing parametric curves. It generates many points by solving the functions. The graph of parametric functions is a major topic in most Design Mathematics courses. Because it looks like the building block of many concepts of CAD. However, there is much more to learn before saying that the third degree NURBS is a degree-3 polynomial function. I am curious about learning the underlying secrets of Rhino’s beautiful curves.
import rhinoscriptsyntax as rs
import math
def f(t): return t * math.sin(t)
def g(t): return t * math.cos(t)
def evaluate(t):
	point = (f(t),g(t),0)
	print "Parametric function is evaluated at t =",t
	print "Resulting point is at",point
	rs.AddPoint(point)
def graph(t0,t1,dt):
	points = []
	t = t0
	while t <= t1:
		points.append((f(t),g(t),0))
		evaluate(t)
		t = t + dt
	points.append((f(t1),g(t1),0))
	rs.AddPolyline(points)
	print "Domain of t is",t0,"to",t1
	print "Number of samples used:",len(points)
graph(-1,12,0.01)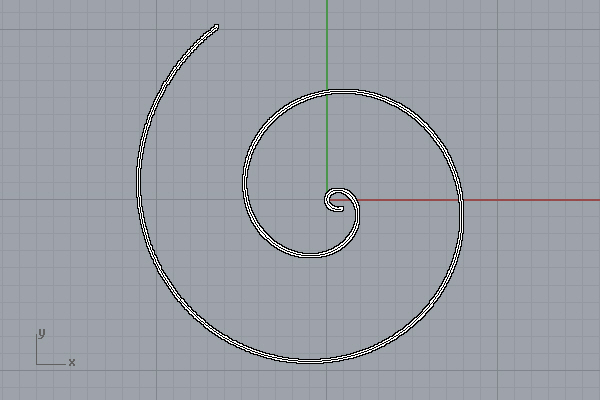
Here is the first trial: The Archimedean Spiral is generated by the code. The Archimedean spiral (also known as the arithmetic spiral) is a spiral named after the 3rd-century BC Greek mathematician Archimedes. It is the locus corresponding to the locations over time of a point moving away from a fixed point with a constant speed along a line that rotates with constant angular velocity. The important part of the code is its flexibility. If you modify the f(t) and g(t) lines, you can calculate the below graphs and more.
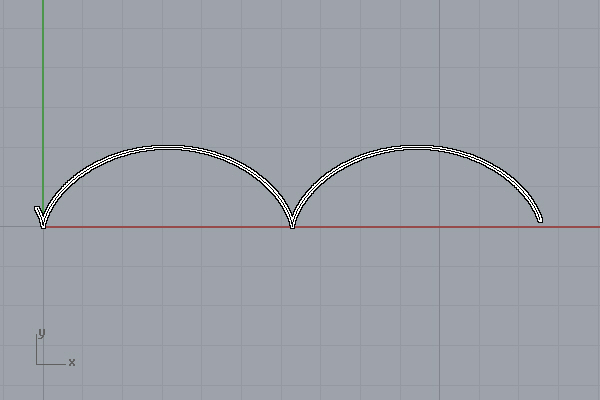
“Cycloid” f(t) = t – sin(t), g(t) = 1 – cos(t). This curve traces a point on a circle as it rolls along a straight line without slipping. You can find many animations of Cycloid and Epicycloid curves on the internet.
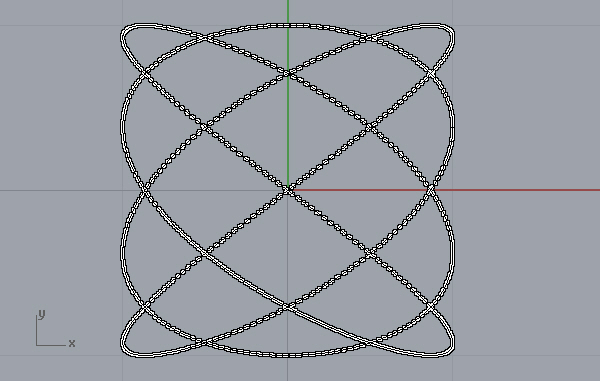
“Lissajous Curve” f(t) = sin(4t), g(t) = cos(3t). This curve describes complex harmonic motions. I played with several variations of it. Nevertheless, this curve can be a good starting point in the introduction of parametric equations and their graphs.
This is a simple method for learning how to create the graph of parametric functions, so do not expect something like desmos. For instance, it can only display points, not curves. This code is the first version of the series in Design Mathematics. Thus, I will improve it in the future.
Cite this post
Related Posts
Cycloid Curves with Rhino Python
August 7, 2017
Studied earlier in Grasshopper here, creating a cycloid-like curve actually mimics the physical process of rotating disks on a path. Below is a test in Rhino Python (I know the variable names are not conventional).
Lissajous Pendants
February 9, 2024
Lissajous curves, named after the French physicist Jules Antoine Lissajous are a family of curves that emerge from the interaction between two harmonic oscillations. They have applications in various fields including physics, engineering, and signal processing. They are commonly used in electronic devices such as oscilloscopes to visualize the phase relationship between two oscillating signals. Similarly, they are also useful in mechanical engineering for analyzing and designing mechanisms that involve harmonic motion. Lissajous curve functions can help in understanding the…
Cycloid Experiment
May 9, 2014
This is a Cycloid-like family of curves, generated by its classical description: a rolling circle. I had several other studies on similar topics before. In this cycloid experiment, I used Grasshopper in which, we don’t need to roll the circle. Instead, we can divide a parametric curve, utilizing data lists to simply rotate a circle around it. Finally, evaluating the circle repeatedly creates a Cycloid-like result. I found this as the most simplistic way of showing and studying these special…
Spherical Cycloid
April 2, 2024
Today’s beautiful curve is the spherical cycloid. It is a cycloid, rolling on a 3d circular path rather than a straight and 2d one. There are algebraic explanations of this curve. Therefore, I find it interesting to experiment with them, since it is more interesting than the regular planar cycloids, epicycloids, and hypocycloids. This curve is believed to have been studied first by Jean Bernoulli in 1732. The interesting and playful part of this is the resulting curve is always…
Discrete Fourier Transform
May 8, 2025
The Fourier Transform is a powerful mathematical technique that allows us to analyze the different frequency components within a signal or shape. Its discrete version, the Discrete Fourier Transform (DFT), is used when working with numerical data. I studied the Fourier Series here before. One of the most fascinating aspects of the DFT is that it can represent a signal or shape using rotating circles (or vectors). Each circle corresponds to a specific frequency, amplitude, and phase. When connected in…