Interface Continued: Grasshopper for Beginners (4)
by Tuğrul Yazar | December 13, 2022 10:01
In this fourth episode of Grasshopper for Beginners[1], the explanation of the graphical user interface[2] continued. We call the data flow diagrams definitions. GH definitions are rendered on a large blank screen area called canvas. We can zoom in and out (zoom) the canvas with the middle mouse wheel. Or pan sideways by holding down the right mouse button. Tabs and panels are menus where all the components of the GH are grouped and placed. Left-clicking on the tabs displays the panels they contain. For example, under the Params tab are the Geometry, Primitive, Input, and Util panels. Thus, left-clicking on the names of the panels displays the components they contain. When we wait for a while with the mouse cursor over the components, we can see the component’s name and a short description.
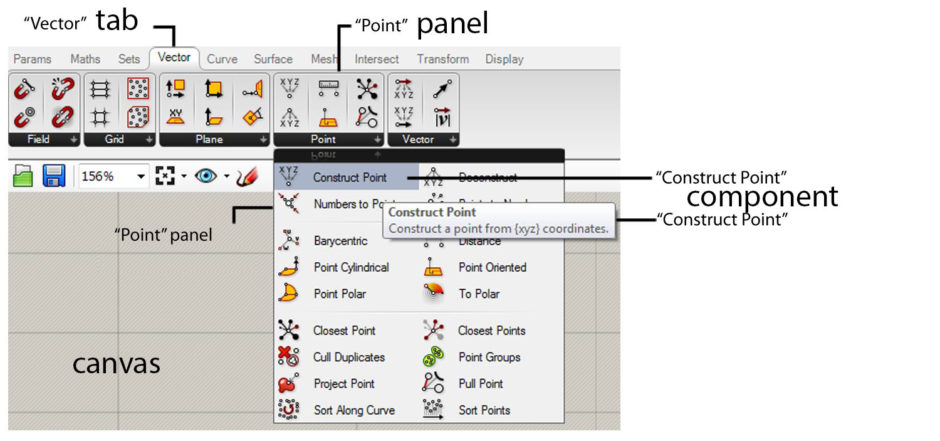
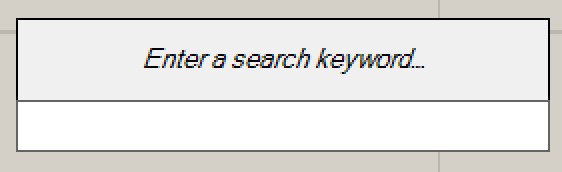
Now take a look at the tabs and panels, and take a look at the components they contain. Cute or cute colorful components are waiting for us to use. In the beginning, the subject of which component is located where and what it does may seem a bit confusing. But as you work, it will be easier to recognize and find them. However, We will be using a significant part of these components in the applications we will make throughout the series. But, we don’t necessarily have to search for a component we want to use in tabs and panels. It is possible to search by double-left-clicking on an empty area on the canvas or by typing the name of the component in the search box. That opens by pressing the Space key on the keyboard.
Today, the explanation of the Grasshopper user interface continued. More content will follow.
- Grasshopper for Beginners: https://www.designcoding.net/grasshopper-for-beginners-1/
- graphical user interface: https://en.wikipedia.org/wiki/Graphical_user_interface
Source URL: https://www.designcoding.net/interface-continued-grasshopper-for-beginners-4/