History: Grasshopper for Beginners (2)
by Tuğrul Yazar | November 23, 2022 17:47
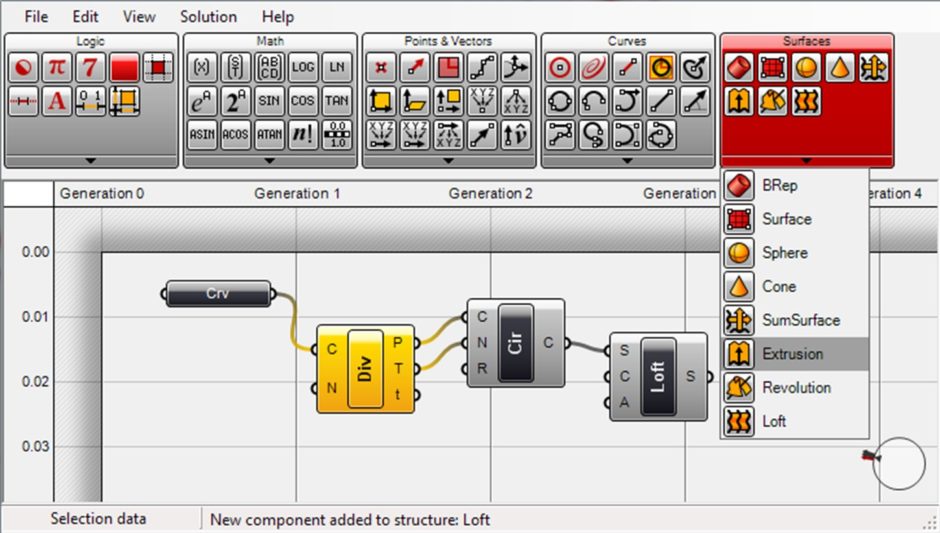
We continue the Grasshopper for Beginners (2) series with the data flow programming concept. Control flow diagrams we use in traditional programming languages control the sequence of executed commands. In data flow diagrams, the focus is not on the order of commands but on how the data progresses.
In the previous example, it doesn’t matter whether the Circle and Polyline command runs first. As a result, both are prerequisites for Extrude. Extrude command will not be executed until both are completed. Therefore, this perspective makes it possible to create real-time and dynamic models. They don’t need the sequence required by languages such as Rhinoscript[1], Maxscript[2], or even a “Run” command. In the data flow modeling process we code with the help of diagrams and generate alternatives rapidly by playing with the data. Moreover, we can investigate different geometric relationships by making changes in the commands and links that appear on the diagram. In addition, we can develop a relational model which is modifiable. For this reason, data flow programming is becoming popular as a design method beyond just a modeling and representation method for designers.
There are also cases where data flow diagrams are disadvantageous and weak compared to control flow. After all, learning GH also involves understanding these limits and looking for ways to transcend them. Throughout this series, we will be learning about these situations and solutions as we get to know GH.
Explicit History
The Explicit History plug-in provides a visual interface to the History command for relational modeling in Rhino, and also makes it possible to perform a series of logical and mathematical operations. David Rutten[3] published Explicit History in 2007, visualized data flow diagrams and made them work on Rhino and formed the basis of GH. GH is a standard toolset in Rhino 6 and 7.
We can store any numeric input needed to create the geometric shapes. For example, we can generate, modify and re-use parameters such as the radius of a circle, the plane on which it sits in Cartesian space, and the position of its center. We can perform mathematical and logical operations on these parameters. Thus, it becomes possible to derive designs that are dynamically updated on the screen and that have both geometric and logical relationships with each other.
This is the end of today’s Grasshopper for Beginners (2) series. More will follow.
- Rhinoscript: https://www.designcoding.net/category/tools-and-languages/rhino-script/
- Maxscript: https://www.designcoding.net/category/tools-and-languages/max-script/
- David Rutten: https://wiki.mcneel.com/people/davidrutten
Source URL: https://www.designcoding.net/grasshopper-for-beginners-2-data-flow-diagrams/