Graph of Parametric Functions
by Tuğrul Yazar | April 6, 2018 00:27
This RhinoPython[1] script handles the simple graphs of two-dimensional parametric functions. Therefore, it approximates these functions by drawing parametric curves[2]. It generates many points by solving the functions. The graph of parametric functions is a major topic in most Design Mathematics[3] courses. Because it looks like the building block of many concepts of CAD. However, there is much more to learn before saying that the third degree NURBS is a degree-3 polynomial function. I am curious about learning the underlying secrets of Rhino’s beautiful curves.
import rhinoscriptsyntax as rs
import math
def f(t): return t * math.sin(t)
def g(t): return t * math.cos(t)
def evaluate(t):
	point = (f(t),g(t),0)
	print "Parametric function is evaluated at t =",t
	print "Resulting point is at",point
	rs.AddPoint(point)
def graph(t0,t1,dt):
	points = []
	t = t0
	while t <= t1:
		points.append((f(t),g(t),0))
		evaluate(t)
		t = t + dt
	points.append((f(t1),g(t1),0))
	rs.AddPolyline(points)
	print "Domain of t is",t0,"to",t1
	print "Number of samples used:",len(points)
graph(-1,12,0.01)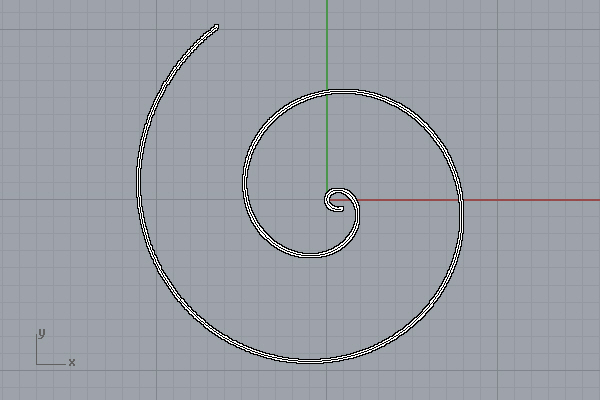
Here is the first trial: The Archimedean Spiral[4] is generated by the code. The Archimedean spiral (also known as the arithmetic spiral) is a spiral named after the 3rd-century BC Greek mathematician Archimedes. It is the locus corresponding to the locations over time of a point moving away from a fixed point with a constant speed along a line that rotates with constant angular velocity. The important part of the code is its flexibility. If you modify the f(t) and g(t) lines, you can calculate the below graphs and more.
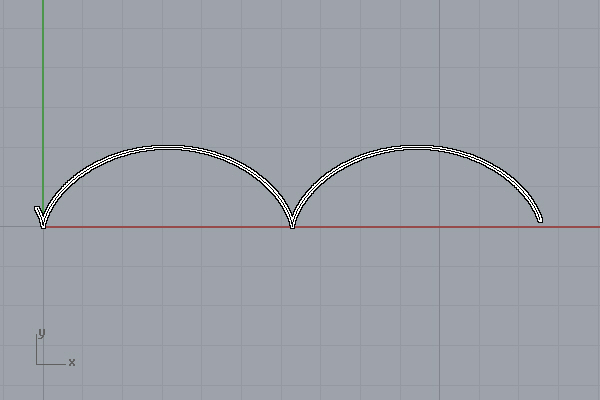
“Cycloid[5]” f(t) = t – sin(t), g(t) = 1 – cos(t). This curve traces a point on a circle as it rolls along a straight line without slipping. You can find many animations of Cycloid and Epicycloid curves on the internet.
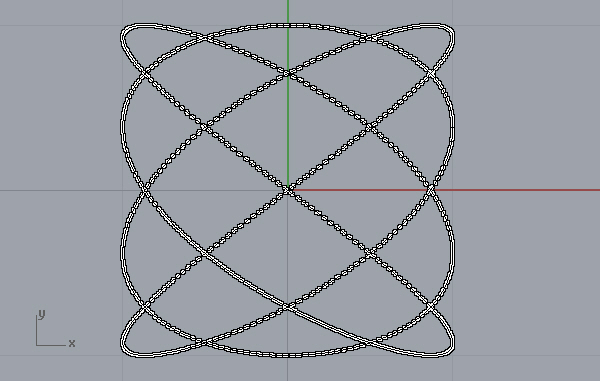
“Lissajous Curve[6]” f(t) = sin(4t), g(t) = cos(3t). This curve describes complex harmonic motions. I played with several variations of it. Nevertheless, this curve can be a good starting point in the introduction of parametric equations and their graphs.
This is a simple method for learning how to create the graph of parametric functions, so do not expect something like desmos[7]. For instance, it can only display points, not curves. This code is the first version of the series in Design Mathematics[3]. Thus, I will improve it in the future.
- RhinoPython: https://www.designcoding.net/category/tools-and-languages/rhino-python/
- parametric curves: https://www.designcoding.net/category/research/parametric-curves/
- Design Mathematics: https://www.designcoding.net/category/education/design-mathematics/
- Archimedean Spiral: https://en.wikipedia.org/wiki/Archimedean_spiral#:~:text=The%20Archimedean%20spiral%20(also%20known,rotates%20with%20constant%20angular%20velocity.
- Cycloid: https://en.wikipedia.org/wiki/Cycloid
- Lissajous Curve: https://en.wikipedia.org/wiki/Lissajous_curve#:~:text=A%20Lissajous%20curve%20%2F%CB%88l,which%20describe%20complex%20harmonic%20motion.
- desmos: https://www.desmos.com/calculator?lang=tr
Source URL: https://www.designcoding.net/graph-of-parametric-functions/