Derivative and Slope
by Tuğrul Yazar | April 6, 2018 00:51
Yes, interesting topics started to reveal themselves, when I dig into the function curves, especially in the parametric representation. The first interesting application is the “derivative”. Nobody in high school told me that the derivative of a function at a given point gives the slope of the graph at that point. Moreover, it is possible to convert the slope value into an angle in degrees, showing the angle of the tangent line to the x-axis at that point. They are very interesting and intuitive for me to understand the deep relationship between maths and all computational tools designers use today. Below is the simplest possible Python script that calculates the slope and tangent angle at a given point of a parametric function graph. It also visualizes the outputs (if you don’t believe me). There are a lot more topics in this and other fields of math, that are waiting to be studied.
Of course, I only approximate the derivative calculation by using a very very small number for “dt”, escaping from the limits. The formula for calculating the derivative is very interesting. I love the elegance of f(x + dx) there… I couldn’t keep myself from drawing that;
# Slope of Parametric Functions
import rhinoscriptsyntax as rs
import math
def f(t): return 3 * math.sin(t)
def g(t): return - 4 * t
def derivativeF(t,dt): return (f(t + dt) - f(t) ) / dt
def derivativeG(t,dt): return (g(t + dt) - g(t) ) / dt
def evaluate(t):
# Evaluate f(t),g(t) and place a point on f(t),g(t)
point = (f(t),g(t),0)
print "Parametric function is evaluated at t =",t
print "Resulting point is at",point
rs.AddPoint(point)
def graph(t0,t1,dt):
# Draw a graph of f(t),g(t) by given domain and step size
points = []
t = t0
while t <= t1:
points.append((f(t),g(t),0))
#evaluate(t)
t = t + dt
points.append((f(t1),g(t1),0))
rs.AddPolyline(points)
print "Domain of t is",t0,"to",t1
print "Number of samples used:",len(points)
def slope(t,dt):
# Slope is the instantaneous ratio of vertical change to horizontal change (dy / dx) at a point
# In a parametric function, slope is dy / dx = (dy / dt) / (dx / dt)
dF = derivativeF(t,dt)
dG = derivativeG(t,dt)
d = dG / dF
print "Slope is",round(d,3),"at t =",t
# Slope of f(t),g(t) indicates the direction of its graph
if d > 0: print "Graph increases from left to right at t =",t
if d < 0: print "Graph decreases from left to right at t =",t
if d == 0: print "This is a constant function"
def tangent(t,dt):
# Tangent is the direction given by the slope
start = (f(t),g(t),0)
dF = derivativeF(t,dt)
dG = derivativeG(t,dt)
d = dG / dF
angle = math.degrees(math.atan(d))
end = rs.Polar(start, angle, 6)
curve = rs.AddLine(start,end)
rs.CurveArrows(curve,2)
# Slope is the tangent result of the angle between the tangent line and x axis
print "Tangent angle is",round(angle,3),"to the x-axis at t =",t
def normal(t,dt):
# Normal is the direction perpendicular to tangent
start = (f(t),g(t),0)
dF = derivativeF(t,dt)
dG = derivativeG(t,dt)
d = dG / dF
angle = math.degrees(math.atan(d))
end = rs.Polar(start, angle + 90, 6)
curve = rs.AddLine(start,end)
rs.CurveArrows(curve,2)
print "Normal angle is",round(angle + 90,3),"to the x-axis at t =",t
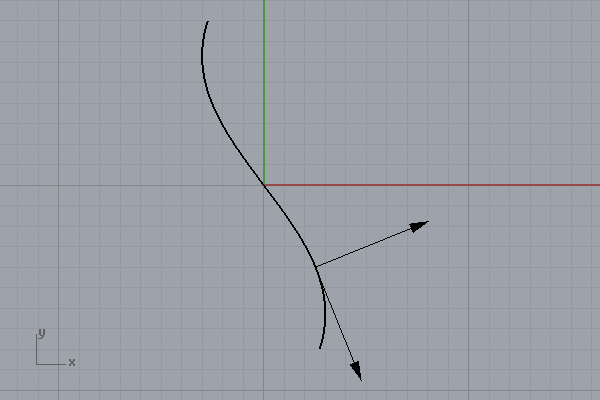
graph(-2,2,0.01)
slope(1,1/10000)
tangent(1,1/10000)
normal(1,1/10000)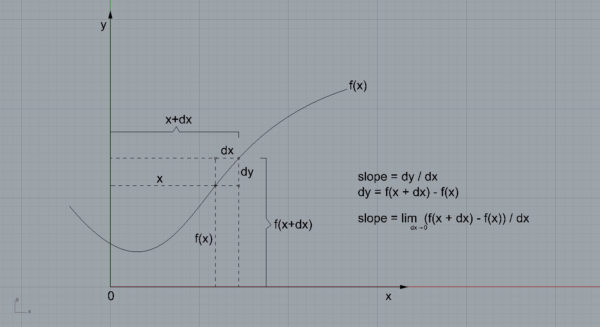 [1]
[1]The above drawing is for an explicit function graph (y = f(x) style). In a parametric curve, the overall derivative is calculated by dividing the derivatives of g(t) and f(t). You’ll notice that in the Python code.
- [Image]: https://www.designcoding.net/decoder/wp-content/uploads/2018/04/2018_04_05-paramslope2.jpg
Source URL: https://www.designcoding.net/derivative-slope-calculus/