Circular Relationship Diagram
by Tuğrul Yazar | May 31, 2015 00:04
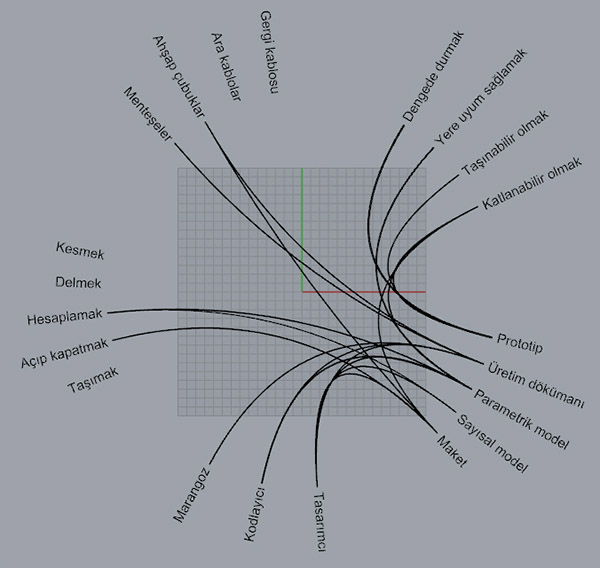
This is done because I needed to represent relationships between different factors and layers of a design process. Although this method of “Chord Diagrams” is a very common technique in information design, it became very hard to find an effective tool for generating those diagrams quickly. There seem to be a solution called “Circos[1]” but however, even installing it on the computer became very boring for me. So I decided to make a Grasshopper definition that generates simple circular relationship diagrams.
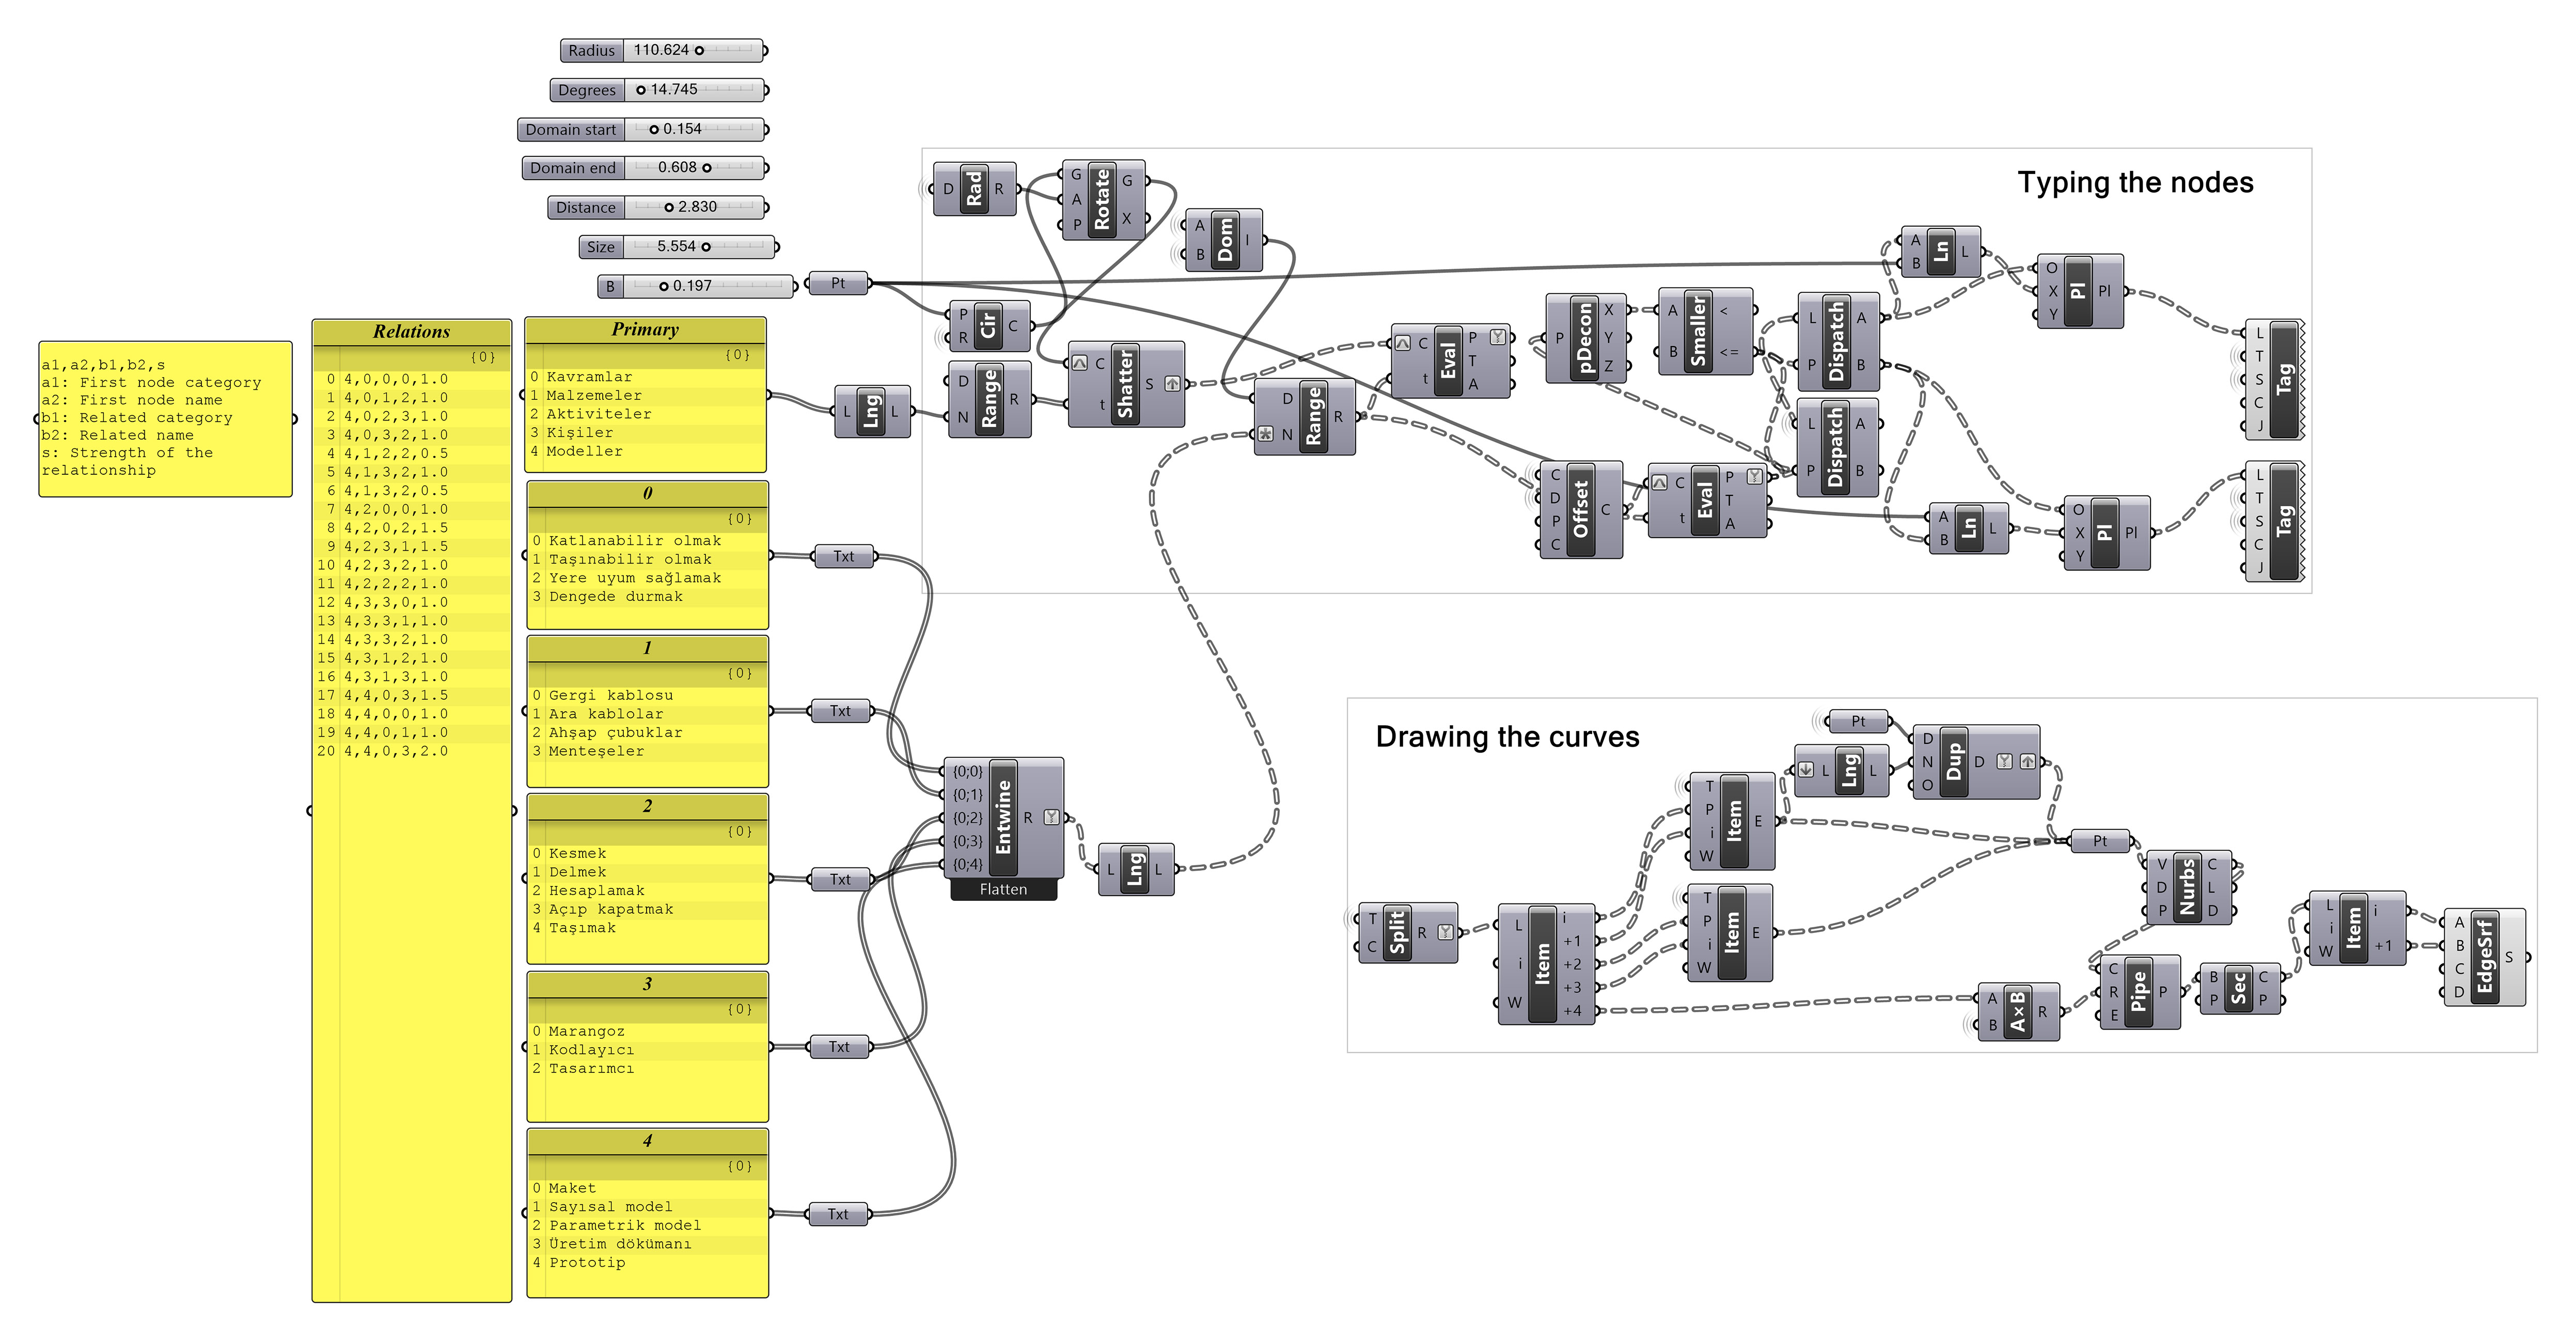
The resulting Grasshopper definition ([GHX: 0.9.0076][2]) seems to be a bit complex for such as simple task, but my intention is to study it further.
 [3]
[3]I didn’t visit grasshopper groups recently to see if there is a special component group for such visualization tasks. Anyway, this is a good idea to do because although Grasshopper is very capable of handling parametric relationships, it lacks representation and visualization.
- Circos: http://circos.ca/
- [GHX: 0.9.0076]: https://www.designcoding.net/decoder/wp-content/uploads/2015/05/2015_05_30-circdia.gh
- [Image]: https://www.designcoding.net/decoder/wp-content/uploads/2015/05/2015_05_30-circdia-def.jpg
Source URL: https://www.designcoding.net/circular-relationship-diagram/